Thank you for your reply
After testing, I was able to successfully run the built program in the simulator.

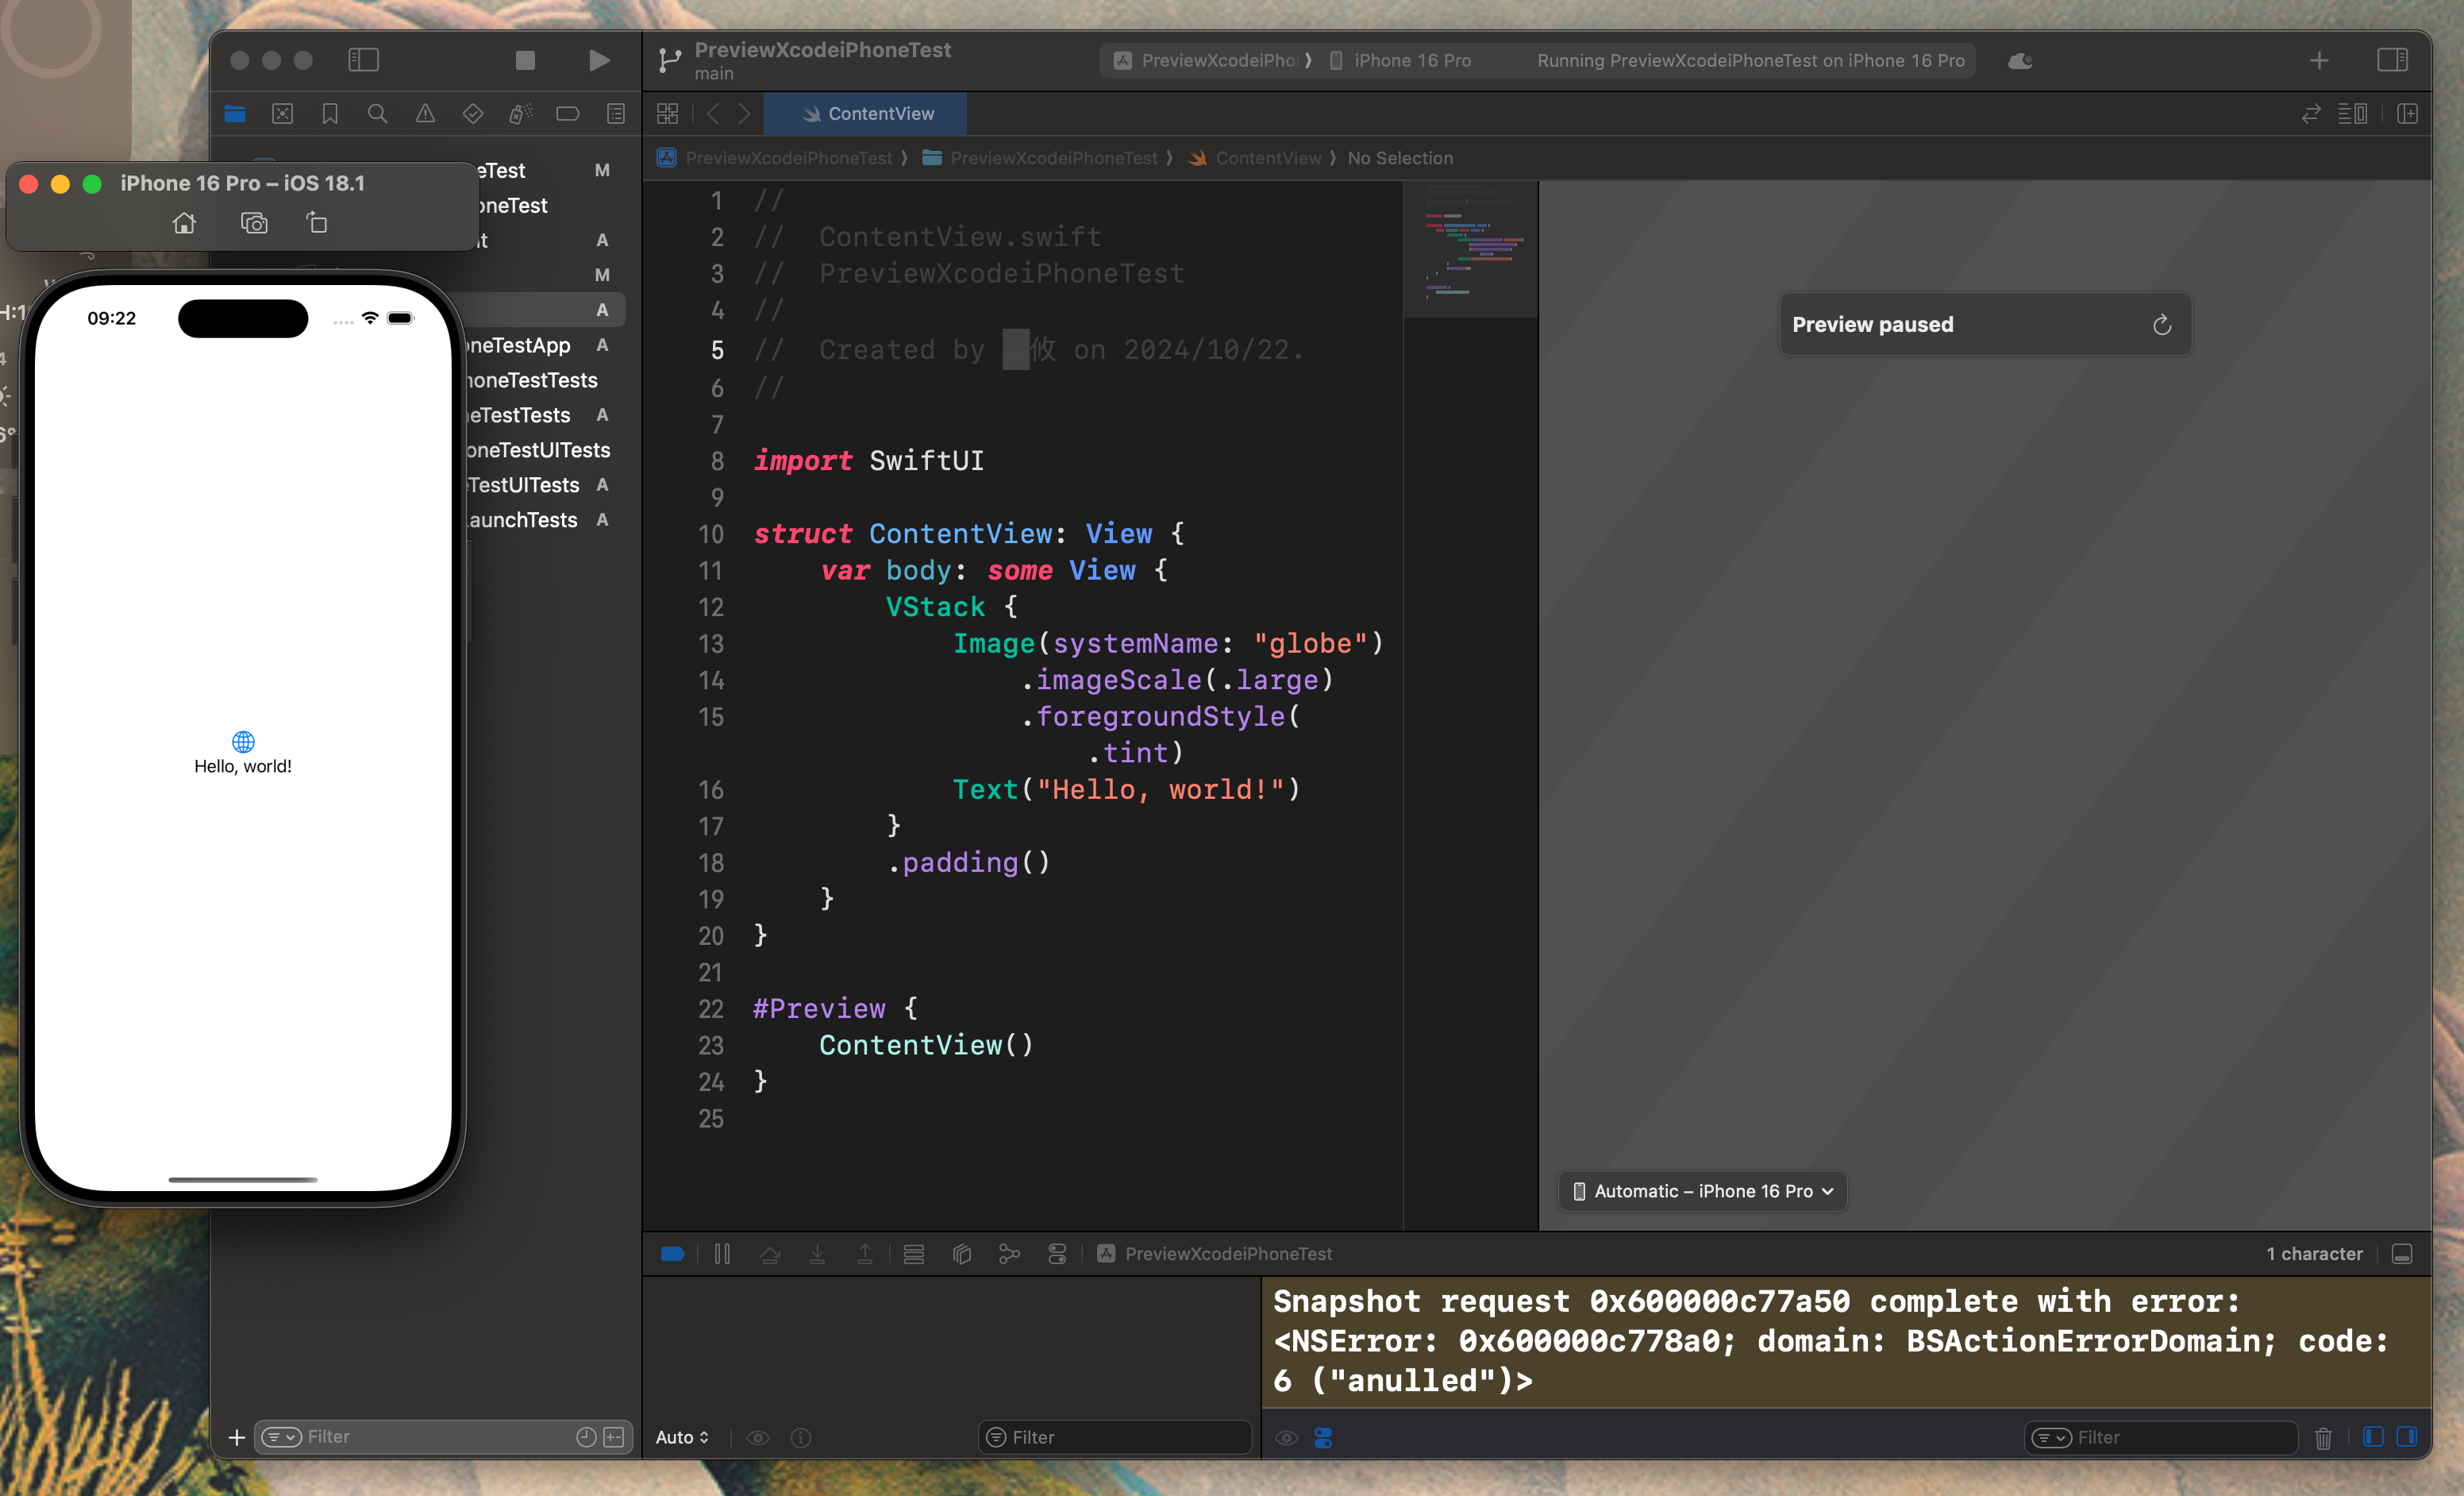
But after I successfully executed xcrun simctl --set previews delete all, the preview interface (simulate iPhone 16) kept spinning icon. Although there were no ongoing tasks in the status bar of the Xcode window (I mean, there were no signs or icons indicating something was being loaded), it still failed.

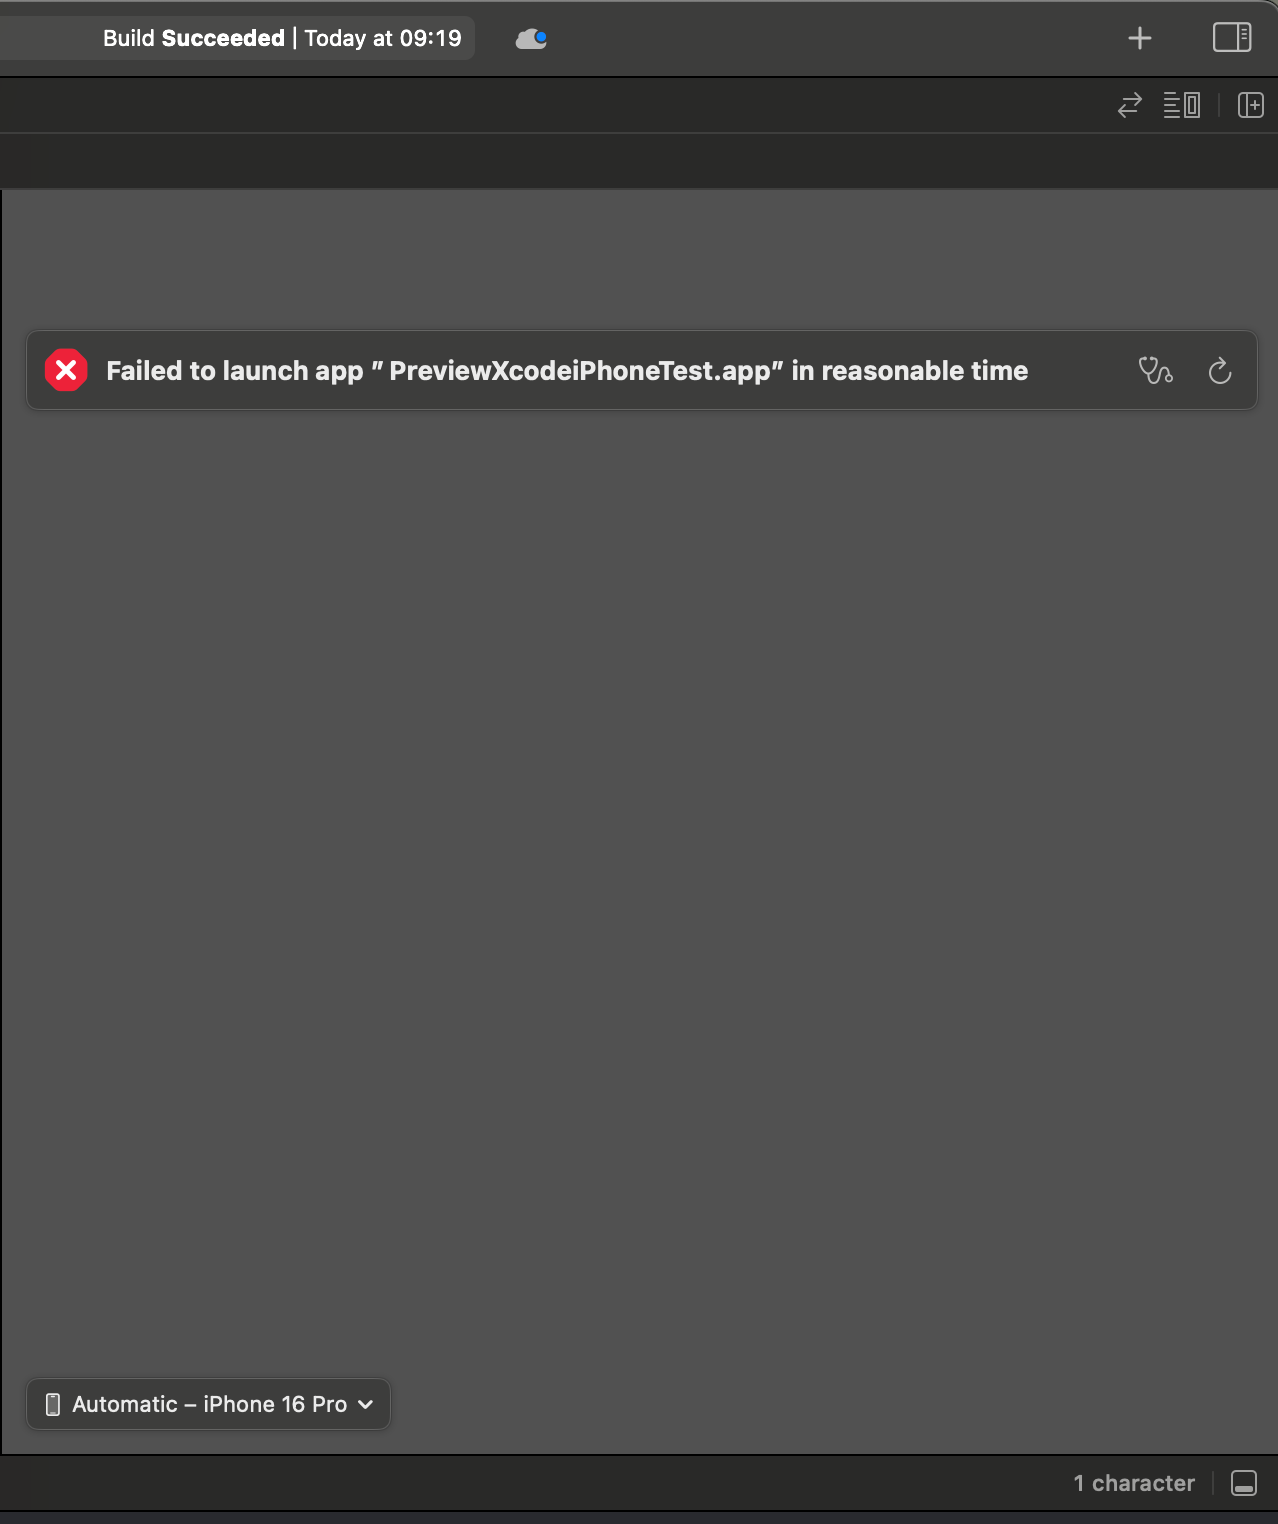
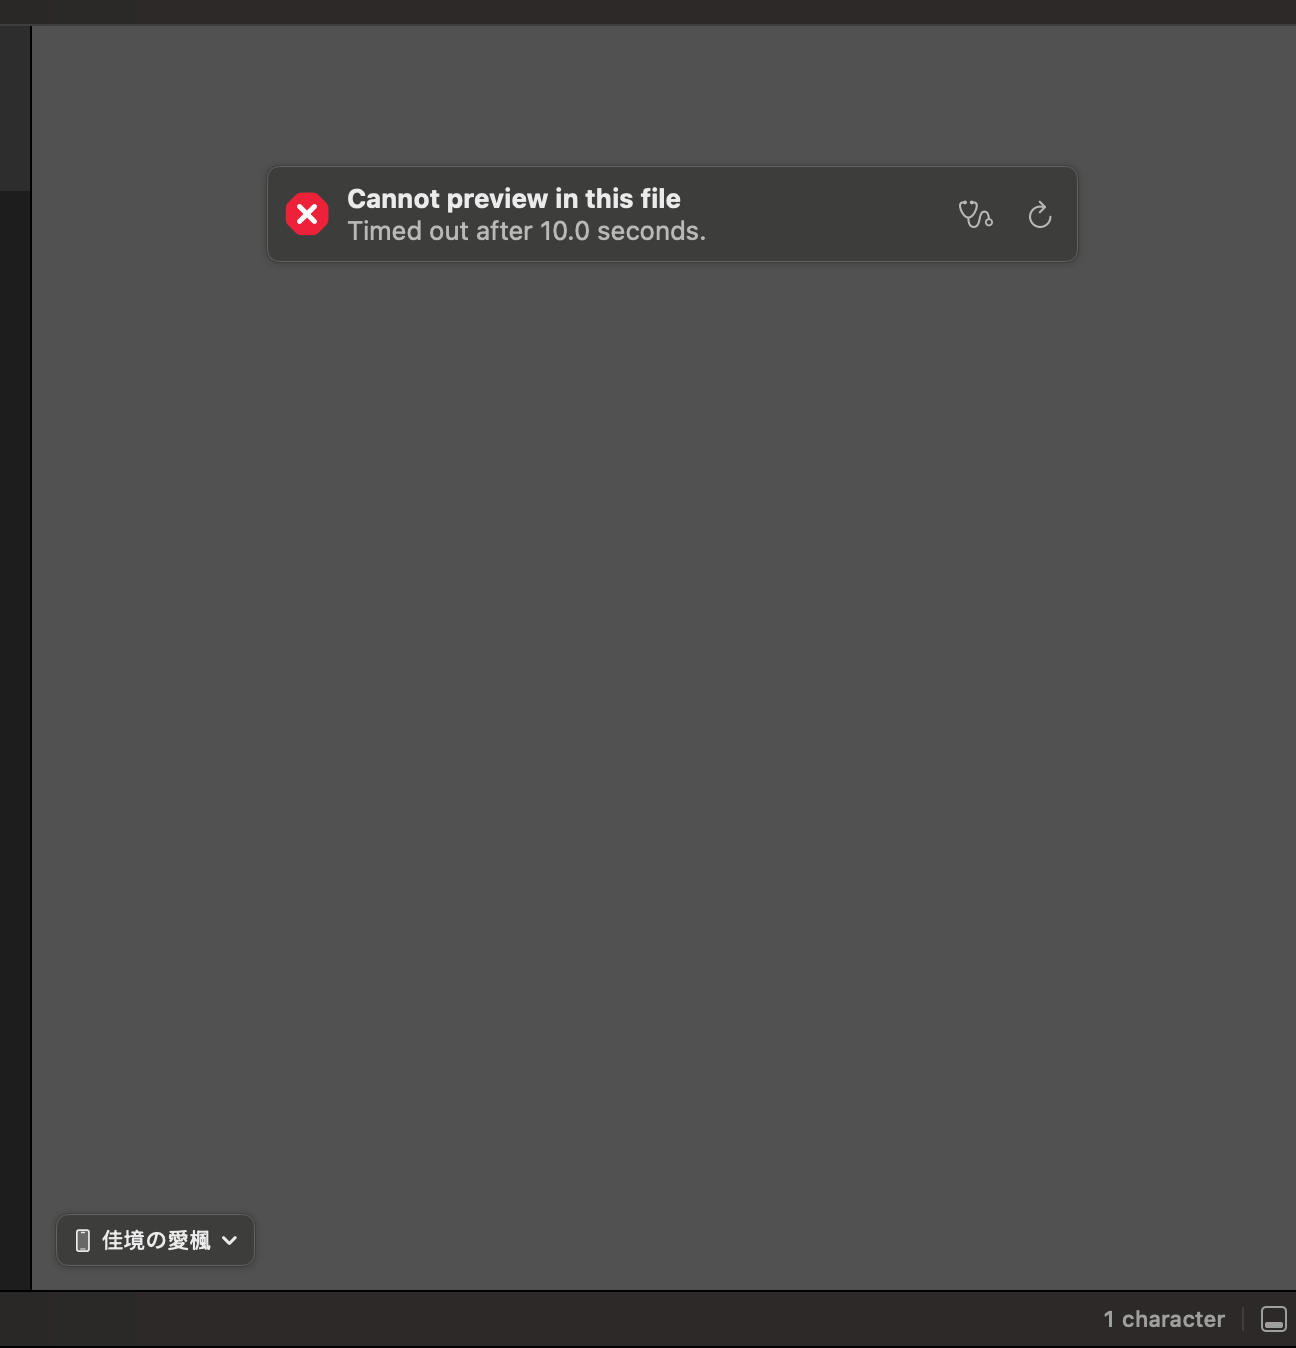
And when I selected my own phone as the Preview, the original issue still occurred.

Meanwhile, it seems that something crashed, followed by Xcode crashing about 2 minutes later. I received two error messages:
-------------------------------------

Translated Report (Full Report Below)

-------------------------------------


Incident Identifier: A761F796-61A8-40B4-8F12-FA6C60BFF212

CrashReporter Key:   [REDACTED]

Hardware Model:      MacBookAir10,1

Process:             MobileCal [11571]

Path:                /Library/Developer/CoreSimulator/Volumes/iOS_22B5045f/Library/Developer/CoreSimulator/Profiles/Runtimes/iOS 18.1.simruntime/Contents/Resources/RuntimeRoot/Applications/MobileCal.app/MobileCal

Identifier:          com.apple.mobilecal

Version:             1.0 (1)

Code Type:           ARM-64 (Native)

Role:                Non UI

Parent Process:      launchd_sim [10911]

Coalition:           com.apple.CoreSimulator.SimDevice.0AA7C584-BFB6-44F5-96BB-2D02B7BADC64 [38990]

Responsible Process: SimulatorTrampoline [42568]


Date/Time:           2024-10-23 09:16:19.2551 +0800

Launch Time:         2024-10-23 09:15:46.6077 +0800

OS Version:          macOS 15.0 (24A335)

Release Type:        User

Report Version:      104


Exception Type:  EXC_CRASH (SIGKILL)

Exception Codes: 0x0000000000000000, 0x0000000000000000

Termination Reason: FRONTBOARD 2343432205

<RBSTerminateContext| domain:10 code:0x8BADF00D explanation:scene-create watchdog transgression: app<com.apple.mobilecal((null))>:11571 exhausted real (wall clock) time allowance of 21.57 seconds

ProcessVisibility: Background

ProcessState: Running

WatchdogEvent: scene-create

WatchdogVisibility: Background

WatchdogCPUStatistics: (

"Elapsed total CPU time (seconds): 103.730 (user 40.930, system 62.800), 56% CPU",

"Elapsed application CPU time (seconds): 0.328, 0% CPU"

) reportType:CrashLog maxTerminationResistance:Interactive>


Triggered by Thread:  0


Kernel Triage:

VM - (arg = 0x0) Waiting on busy page was interrupted
-------------------------------------
Translated Report (Full Report Below)
-------------------------------------

Process:               Xcode [10575]
Path:                  /Applications/Xcode.app/Contents/MacOS/Xcode
Identifier:            com.apple.dt.Xcode
Version:               16.0 (23051)
Build Info:            IDEApplication-23051000000000000~2 (16A242d)
App Item ID:           497799835
App External ID:       869020508
Code Type:             ARM-64 (Native)
Parent Process:        launchd [1]
User ID:               501

Date/Time:             2024-10-23 09:16:35.8507 +0800
OS Version:            macOS 15.0 (24A335)
Report Version:        12
Anonymous UUID:        [REDACTED]

Time Awake Since Boot: 91000 seconds

System Integrity Protection: enabled

Crashed Thread:        12

Exception Type:        EXC_BAD_ACCESS (SIGSEGV)
Exception Codes:       KERN_INVALID_ADDRESS at 0x8000000000000010 -> 0x0000000000000010 (possible pointer authentication failure)
Exception Codes:       0x0000000000000001, 0x8000000000000010

Termination Reason:    Namespace SIGNAL, Code 11 Segmentation fault: 11
Terminating Process:   exc handler [10575]

VM Region Info: 0x10 is not in any region.  Bytes before following region: 4304338928
      REGION TYPE                    START - END         [ VSIZE] PRT/MAX SHRMOD  REGION DETAIL
      UNUSED SPACE AT START
--->
      __TEXT                      1008f0000-1008f4000    [   16K] r-x/r-x SM=COW  /Applications/Xcode.app/Contents/MacOS/Xcode